How To Create Tailwind CSS Line Chart
As a web developer, I understand the importance of effective data visualization in presenting complex information in a clear and understandable manner. When it comes to displaying trends and patterns over time, line charts are invaluable tools.
While working with Tailwind CSS, a powerful utility-first CSS framework, I realized that it lacks pre-built components specifically designed for creating line charts.
However, by combining Tailwind CSS with Chart.js, a versatile charting library, I discovered a seamless way to incorporate visually stunning line charts into my Tailwind CSS projects.
In this article, I will guide you through the process of creating dynamic and customizable line charts using Tailwind CSS. With this knowledge, you'll be able to enhance your data visualization capabilities and effortlessly integrate captivating line charts into your web applications.
Whether you need to showcase financial data, analyze user behavior, or present any other time-based information, this tutorial will equip you with the skills to create beautiful line charts that perfectly align with the aesthetics and functionality of your Tailwind CSS project.
Let's dive in and unlock the potential of line charts with Tailwind CSS.
Prerequisites:
To follow along with this tutorial, you should have a basic understanding of HTML, CSS, and JavaScript. Familiarity with Tailwind CSS and the ability to set up a project using npm or a similar package manager would be beneficial.
Before we begin creating line charts, we need to set up a Tailwind CSS project. You can set up a project using the official Tailwind CSS documentation or any other preferred method. Once your project is ready, we can move on to the next step.
To create line charts, we'll use a charting library called Chart.js. Chart.js is a versatile and easy-to-use library that supports various types of charts, including line charts. Begin by installing Chart.js using npm or by including it directly from a CDN.
In your HTML file, create a canvas element where the line chart will be rendered. Give the element an ID for easy identification.
<canvas class="p-6" id="chartLine"></canvas>
In your JavaScript file, import Chart.js and initialize a new line chart using the canvas element's ID.
      const configLineChart = {
        type: "line",
        data:{
			// Add data and labels here
		},
        options: {
			// Configure chart options here
		},
      };

      var chartLine = new Chart(
        document.getElementById("chartLine"),
        configLineChart
      );
In the data property of the chart configuration, provide the necessary data and labels for your line chart. The data should be an array of values, and the labels should be an array of corresponding labels for each data point.
datasets: [
          {
            label: "Tailwind CSS",
            backgroundColor: "black",
            borderColor: 'rgb(0, 0, 0)',
            data: [0, 10, 5, 2, 20, 30, 45],
            fill: false,
          },
        ],
Tailwind CSS allows you to easily customize the appearance of your line chart. You can modify the chart's colors, labels, axes, and more by using Tailwind CSS utility classes. Refer to the Tailwind CSS documentation for a comprehensive list of available classes.
Example:
<!DOCTYPE html>
<html lang="en">
<head>
<meta charset="UTF-8" />
<meta http-equiv="X-UA-Compatible" content="IE=edge" />
<meta name="viewport" content="width=device-width, initial-scale=1.0" />
<title>Tailwind CSS Line Chart Example - Techsolutionstuff </title>
<script src="https://cdn.tailwindcss.com"></script>
</head>
<body>
<div class="container mx-auto p-60">
<div class="overflow-hidden rounded-lg shadow-md">
<div class="px-5 py-3 bg-stone-300">
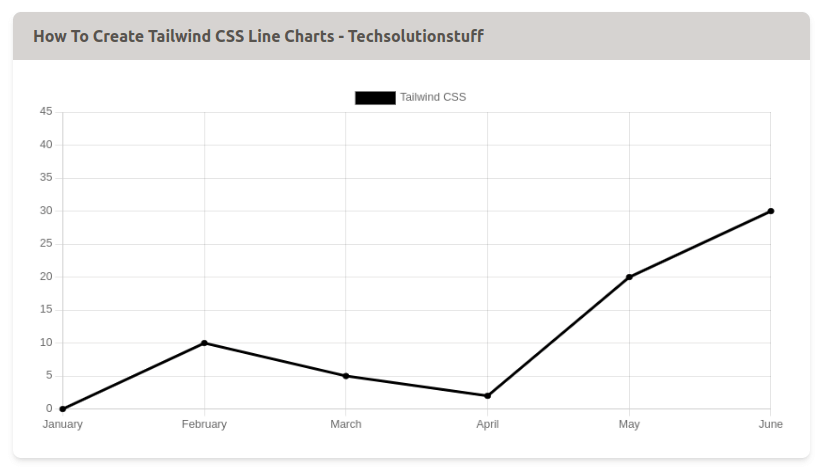
<h5 class="font-bold text-stone-600">
How To Create Tailwind CSS Line Chart - Techsolutionstuff
</h5>
</div>
<canvas class="p-6" id="chartLine"></canvas>
</div>
</div>
<script src="https://cdnjs.cloudflare.com/ajax/libs/Chart.js/3.9.1/chart.min.js"
integrity="sha512-ElRFoEQdI5Ht6kZvyzXhYG9NqjtkmlkfYk0wr6wHxU9JEHakS7UJZNeml5ALk+8IKlU6jDgMabC3vkumRokgJA=="
crossorigin="anonymous" referrerpolicy="no-referrer"></script>
<script>
const labels = ["January", "February", "March", "April", "May", "June"];
const data = {
labels: labels,
datasets: [
{
label: "Tailwind CSS",
backgroundColor: "black",
borderColor: 'rgb(0, 0, 0)',
data: [0, 10, 5, 2, 20, 30, 45],
fill: false,
},
],
};
const configLineChart = {
type: "line",
data,
options: {},
};
var chartLine = new Chart(
document.getElementById("chartLine"),
configLineChart
);
</script>
</body>
</html>
With the help of Chart.js and the styling capabilities of Tailwind CSS, creating line charts becomes a straightforward process. By following the steps outlined in this article, you can generate beautiful and interactive line charts that seamlessly integrate with your Tailwind CSS project.
Output:
You might also like:
- Read Also: Laravel 9 Dynamic Line Chart Example
- Read Also: Google Line Chart Example in Laravel 8
- Read Also: How to Get Current URL in Laravel
- Read Also: How To Integrate Paypal Payment Gateway In Laravel 8


