How To Create Tailwind CSS Bar Chart
As a web developer, I understand the significance of data visualization in conveying information in a visually appealing and easily understandable manner. Bar charts serve as powerful tools for comparing data and identifying patterns.
However, while working with Tailwind CSS, I discovered that it doesn't provide pre-built components specifically designed for creating bar charts. Nonetheless, through my exploration and experimentation, I found a solution by combining Tailwind CSS with additional libraries.
In this article, I will walk you through a step-by-step process of creating bar charts using Tailwind CSS and complementary tools. By the end of this tutorial, you will possess the skills and knowledge necessary to seamlessly integrate stunning bar charts into your Tailwind CSS projects.
Join me as we delve into the world of data visualization and learn how to create impressive bar charts that effectively communicate your data while enhancing the visual appeal of your applications.
Let's embark on this exciting journey of creating bar charts with Tailwind CSS.
Prerequisites:
To follow along with this tutorial, it is recommended to have a basic understanding of HTML, CSS, and JavaScript. Familiarity with Tailwind CSS and setting up a project using npm or a similar package manager will be helpful.
Before we begin creating bar charts, ensure that you have a Tailwind CSS project set up. You can refer to the official Tailwind CSS documentation or choose your preferred method to set up the project. Once your project is ready, we can move on to the next step.
To create bar charts, we will utilize a charting library called Chart.js. Chart.js is a flexible and user-friendly library that supports various types of charts, including bar charts. Start by installing Chart.js using npm or by including it directly from a CDN.
In your HTML file, create a canvas element where the bar chart will be rendered. Assign it an ID for easy identification.
<canvas id="barChart"></canvas>
In your JavaScript file, import Chart.js and initialize a new bar chart using the canvas element's ID.
const barChartElement = document.getElementById('barChart');
const barChart = new Chart(barChartElement, {
  type: 'bar',
  data: {
    // Add data and labels here
  },
  options: {
    // Configure chart options here
  },
});
Within the chart configuration data property, provide the necessary data and labels for your bar chart. The data should be an array of values, and the labels should be an array of corresponding labels for each data point.
data: {
  labels: ['Red', 'Blue', 'Yellow', 'Green', 'Purple', 'Orange'],
  datasets: [
    {
      label: 'Data',
      data: [12, 19, 3, 5, 2, 3],
    },
  ],
},
Tailwind CSS allows you to easily customize the appearance of your bar chart. Utilize Tailwind CSS utility classes to modify the chart's colors, labels, axes, and more. Refer to the Tailwind CSS documentation for an extensive list of available classes.
Example:
<!DOCTYPE html>
<html lang="en">
<head>
<meta charset="UTF-8" />
<meta http-equiv="X-UA-Compatible" content="IE=edge" />
<meta name="viewport" content="width=device-width, initial-scale=1.0" />
<title>Tailwind CSS Bar Chart Example - Techsolutionstuff </title>
<script src="https://cdn.tailwindcss.com"></script>
</head>
<body>
<div class="container mx-auto p-60">
<div class="overflow-hidden rounded-lg shadow-md">
<div class="px-5 py-3 bg-stone-300">
<h5 class="font-bold text-stone-600">
How To Create Tailwind CSS Bar Chart - Techsolutionstuff
</h5>
</div>
<canvas class="p-6" id="barChart"></canvas>
</div>
</div>
<script src="https://cdnjs.cloudflare.com/ajax/libs/Chart.js/3.9.1/chart.min.js"
integrity="sha512-ElRFoEQdI5Ht6kZvyzXhYG9NqjtkmlkfYk0wr6wHxU9JEHakS7UJZNeml5ALk+8IKlU6jDgMabC3vkumRokgJA=="
crossorigin="anonymous" referrerpolicy="no-referrer"></script>
<script>
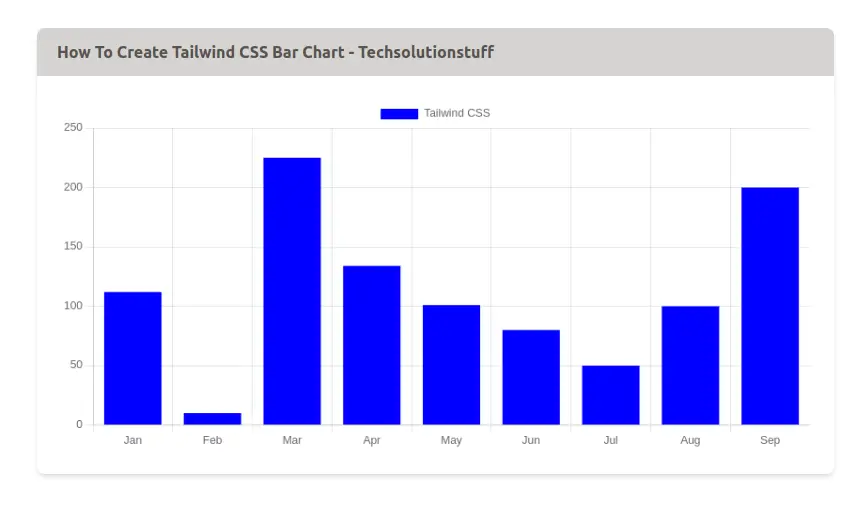
const labels = ['Jan', 'Feb', 'Mar', 'Apr', 'May', 'Jun', 'Jul', 'Aug', 'Sep'];
const data = {
labels: labels,
datasets: [
{
label: "Tailwind CSS",
backgroundColor: "blue",
borderColor: 'rgb(0, 0, 0)',
data: [112, 10, 225, 134, 101, 80, 50, 100, 200],
fill: false,
},
],
};
const configChart = {
type: "bar",
data,
options: {},
};
var chartLine = new Chart(
document.getElementById("barChart"),
configChart
);
</script>
</body>
</html>
By combining the capabilities of Chart.js with the flexibility of Tailwind CSS, creating bar charts becomes a straightforward process. In this article, we have walked through the step-by-step procedure for generating visually compelling and interactive bar charts using Tailwind CSS.
Output:
You might also like:
- Read Also: Laravel 8 Google Bar Chart Example
- Read Also: How To Use Google Bar Chart In Vue JS
- Read Also: Role And Permission In Laravel 9 Tutorial
- Read Also: How To Create Dynamic Bar Chart In Laravel


