How To Create Dynamic Pie Chart In Laravel 8
Hello Friends, In this tutorial I will show you how to create dynamic pie chart in laravel 8, Pie charts are use to representing data in graphics view, for creation of dynamic pie chart in laravel 8 example you need to create model, controller, route, blade file and database.
In laravel 8 dynamic pie chart we need some basic js file like, echarts.min.js and some other js and css file.
So, let's see how to create dynamic pie chart in laravel 8.
Step 1 : Install Laravel 8 for Dynamic Pie Chart Example
Step 2 : Create Model and Migration for Pie Chart Example in Laravel 8
Step 3 : Add Route in web.php file
Step 4 : Create Controller
Step 5 : Create Blade File
Type the below command in your terminal to create new project of dynamic pie chart.
composer create-project --prefer-dist laravel/laravel echart
Here, we are collecting data from database to dynamic data for pie chart example. So, create migration for product table using artisan command.
php artisan make: model Product -m
After that add below codein this location "database/migrations/"
<?php

use Illuminate\Database\Migrations\Migration;
use Illuminate\Database\Schema\Blueprint;
use Illuminate\Support\Facades\Schema;

class CreateProductsTable extends Migration
{
    /**
     * Run the migrations.
     *
     * @return void
     */
    public function up()
    {
        Schema::create('products', function (Blueprint $table) {
            $table->id();
            $table->string('name')->nullable();
            $table->integer('price')->nullable();
            $table->integer('year')->nullable();
            $table->string('product_type')->nullable();
            $table->timestamps();
        });
    }

    /**
     * Reverse the migrations.
     *
     * @return void
     */
    public function down()
    {
        Schema::dropIfExists('products');
    }
}
after this we need to run this migration by following command in our terminal:
php artisan migrate
Now add route in routes/web.php
<?php

use Illuminate\Support\Facades\Route;

use App\Http\Controllers\Admin\EchartController;

Route::get('echarts', [EchartController::class,'echart']);
After adding route we need to create new conroller and model for pie chart example. so type below command for create controller.
php artisan make:controller EchartController
Add below code in your Product Model in app\Models\Product.php this file.
<?php

namespace App\Models;

use Illuminate\Database\Eloquent\Factories\HasFactory;
use Illuminate\Database\Eloquent\Model;

class Product extends Model
{
    use HasFactory;

    protected $table = 'products';
    protected $guarded = [];
}
Add below code in your app\Http\Controllers\EchartController.php
<?php

namespace App\Http\Controllers;
use App\Models\Product;
use Illuminate\Http\Request;

class EchartController extends Controller
{
    public function echart(Request $request)
    {
    	$fruit = Product::where('product_type','fruit')->get();
    	$veg = Product::where('product_type','vegitable')->get();
    	$grains = Product::where('product_type','grains')->get();
    	$fruit_count = count($fruit);
    	$veg_count = count($veg);
    	$grains_count = count($grains);
    	return view('echart',compact('fruit_count','veg_count','grains_count'));
    }
}
Now, we will creating echart.blade.php file for view.
<!DOCTYPE html>
<html>
<head>
	<meta charset="utf-8">
	<meta http-equiv="X-UA-Compatible" content="IE=edge">
	<title>How To Create Dynamic Pie Chart In Laravel 8 - Techsolutionstuff</title>
	<link rel="stylesheet" href="https://maxcdn.bootstrapcdn.com/bootstrap/3.3.7/css/bootstrap.min.css">
	<link href="{{asset('assets/css/components.min.css')}}" rel="stylesheet" type="text/css">
	<script type="text/javascript" src="{{asset('assets/js/jquery.min.js')}}"></script>
	<script type="text/javascript" src="{{asset('assets/js/bootstrap.bundle.min.js')}}"></script>
	<script type="text/javascript" src="{{asset('assets/js/echarts.min.js')}}"></script>
</head>
<body>
<div class="col-md-12">
	<h1 class="text-center">How To Create Dynamic Pie Chart In Laravel 8 - Techsolutionstuff</h1>
	<div class="col-xl-6" style="margin-top: 30px;">
		<div class="card">
			<div class="card-body">
				<div class="chart-container">
					<div class="chart has-fixed-height" id="pie_basic"></div>
				</div>
			</div>
		</div>
	</div>
</div>
</body>
</html>
<script type="text/javascript">
var pie_basic_element = document.getElementById('pie_basic');
if (pie_basic_element) {
    var pie_basic = echarts.init(pie_basic_element);
    pie_basic.setOption({

        textStyle: {
            fontFamily: 'Roboto, Arial, Verdana, sans-serif',
            fontSize: 13
        },

        title: {
            text: 'Pie Chart Example',
            left: 'center',
            textStyle: {
                fontSize: 17,
                fontWeight: 500
            },
            subtextStyle: {
                fontSize: 12
            }
        },

        tooltip: {
            trigger: 'item',
            backgroundColor: 'rgba(0,0,0,0.75)',
            padding: [10, 15],
            textStyle: {
                fontSize: 13,
                fontFamily: 'Roboto, sans-serif'
            },
            formatter: "{a} <br/>{b}: {c} ({d}%)"
        },

        legend: {
            orient: 'horizontal',
            bottom: '0%',
            left: 'center',
            data: ['Fruit', 'Vegitable','Grains'],
            itemHeight: 8,
            itemWidth: 8
        },

        series: [{
            name: 'Product Type',
            type: 'pie',
            radius: '70%',
            center: ['50%', '50%'],
            itemStyle: {
                normal: {
                    borderWidth: 1,
                    borderColor: '#fff'
                }
            },
            data: [
                {value: {{$fruit_count}}, name: 'Fruit'},
                {value: {{$veg_count}}, name: 'Vegitable'},
                {value: {{$grains_count}}, name: 'Grains'}
            ]
        }]
    });
}
</script>
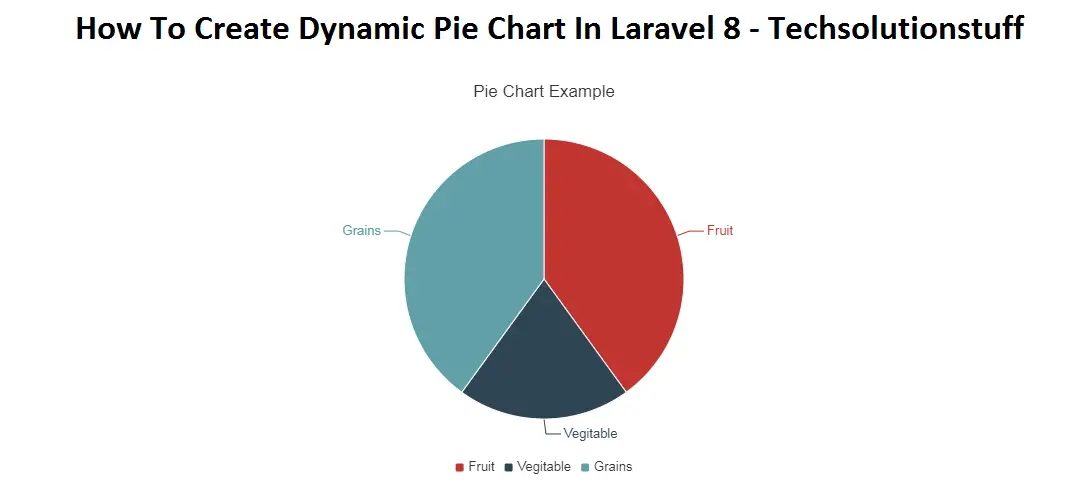
And you will get output like below image.
You might also Like :
- Read Also : How to Install VueJs in Laravel
- Read Also : Autotab To Next Input Field JQuery Example
- Read Also : How To Check Password Strength Using JQuery
- Read Also : How To Create Cron Job Schedule In Laravel 7/8


